- Subscribe to RSS Feed
- Mark as New
- Mark as Read
- Bookmark
- Subscribe
- Printer Friendly Page
- Report Inappropriate Content
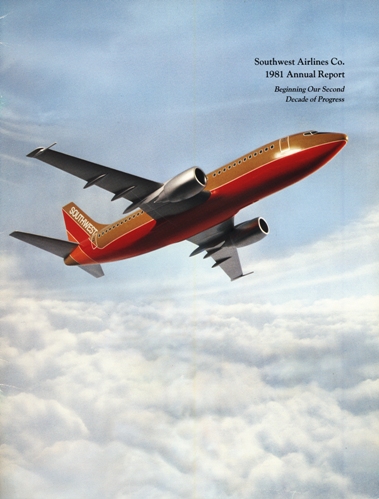
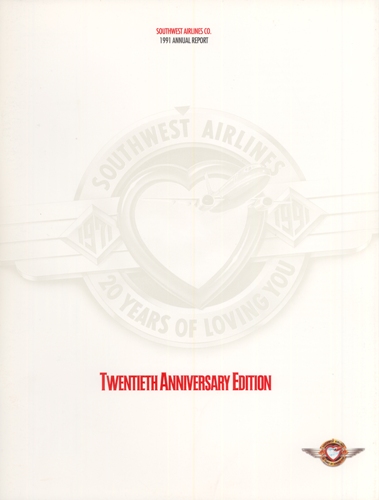
This week, we take a different approach to Southwest’s history by tracking some measurements of our growth over our first 40 years. Upfront, I have to admit that I am intimidated by numbers, especially those used to express economic terms. I just squeaked by my college Economics class (although I do remember we played a neat board game). However, while doing research in our past annual reports for another project, I found some numbers that illustrate how far we have come as a Company. While doing my research, I was also reminded again that the annual report is a wonderful document, filled with interesting information. For the purpose of my research, I used the “landmark” anniversary years of the fifth, tenth, 15th, etc. publications. Don’t worry, I still have included some photos representing some of the covers of these reports.

We start with just two numbers, the amount of fuel we used during our first year, 1971, and the fuel used during our 40th year, 2011. That first year, we burned about five million gallons of jet fuel, but contrast that with the approximately 1.8 billion gallons used in 2011. Of course in that time, we had expanded from an airline with three airplanes serving three cities in Texas to a coast-to-coast carrier. And speaking of aircraft, take a look at these numbers:
Aircraft at year-end
1971: 4
1976: 6
1981: 27
1986: 79
1991: 124
1996: 243
2001: 355
2006: 481
2011: 698 (includes AirTran)
Let’s compare that with the number of Employees across the years:
Year-end Employees
1971: 195
1976: 517
1981: 2,129
1986: 5,819
1991: 9,778
1996: 22,944
2001: 31,580
2006: 32,664
2011: 45,392 (includes AirTran)
To me, it’s illuminating that both the number of aircraft and the number of Employees in 1971 are .05 percent of the 2011 both numbers. Again, I’m no economist, but that represents a pretty balanced growth in these two categories. The two categories below also have a relationship, although not a direct correlation with each other..
Fuel cost Average Fare
1971: $0.11 per gallon 1971: $19.62
1976: $0.33 per gallon 1976: $19.80
1981: $1.01 per gallon 1981: $38.07
1986: $0.51 per gallon 1986: $54.43
1991: $0.66 per gallon 1991: $55.93
1996: $0.66 per gallon 1996: $65.88
2001: $0.71 per gallon 2001: $83.46
2006: $1.53 per gallon 2006: $104.40
2011: $3.19 per gallon 2011: $141.72
The obvious connection is that our fares go up when the cost of fuel goes up. And, during our first 40 years, the biggest fuel cost increase occurred between 2006 and 2011, when fuel rose by $1.66 per gallon. In fact, in the first 40 years after we took to the sky, the cost of jet fuel in 1971 represents three percent of 2011's price. In contrast, our average fare in 1971 was a more robust 13 percent of 2011's number. Compare this with the 30-year period ending in 2001, when the 9/11 attacks changed the industry overnight. For those first 30 years, 1971's fuel price was 16 percent of 2001's and the average fare in 1971 was 24 percent of 2011's prices, both at appreciably lower rates than those recorded in 2011. If you need an example of the volatility of the industry since 2011, let’s look at the first 25 years. Comparing 1996 to 1971, the fuel price in 1971 was 83 percent of the price in 1996, but our average ticket price in 1971 was 30 percent of 1996's. All it takes is a look at the charts to see the rapid changes since 2001 and to compare those numbers with the relative stability of the first 30 years. (In case you are wondering why 1981’s fuel prices were so high, it was because of the Iran-Iraq war which isolated prime oil supplies from the rest of the world.)

Don't worry, Flashback Fridays aren't going to turn into a numbers series, but I thought this research really told an interesting story that I wanted to share with you.
You must be a registered user to add a comment. If you've already registered, sign in. Otherwise, register and sign in.